

GVERSE Geo+
Fully Integrated 3D Interpretation
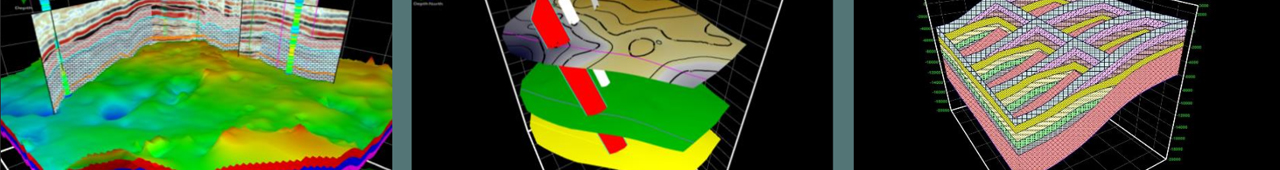
The integrated application combines geological, geophysical, petrophysical, GIS, and engineering data in a single environment, with real-time 3D visualization of the developing geomodel that helps interpret the results from different domains of geosciences and formulate optimized and cost-effective field development solutions.
Surface relationships are modeled in a dynamic real-time environment. The geosurface model can be configured to generate surface conformance relationships, unconformity trimming, channel geometries, subcrop mapping, fault offset and automatic fault polygon generation, as well as gross, net, and net/gross reservoir maps.
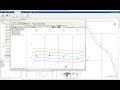
 Surface Offset lines for analyzing drilling targets.- GVERSE Geo+
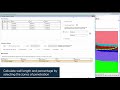
 Calculate length, percentage & engineering parameters of wellbore in multiple zones of penetration
 Calculate Well in Zone with GVERSE Geo+
 Block Diagrams in GVERSE Geo+
GVERSE GeoGraphix Geo+ Surface Interactions
GVERSE GeoGraphix Geo+ Modifications
Real-time Integrated Visualization of Results
GVERSE Geo+ provides an integrated real-time map view, cross section view, and 3D visualization of the developing geomodel. GVERSE Geo+ integrates petrophysical, geophysical, drilling, and GIS data into the interpretation to observe the real time effect of what-if scenarios on a developing geomodel.Quick and Easy
As compared to traditional tools, GVERSE Geo+ allows geoscientists to load, integrate, interpret, and display large datasets with minimum time and effort required.Flexibility
Features like the ability to Quick Pick surface tops and fault cuts on cross sections and the map view, clip the 3D gird, develop fence diagrams, create modeling regions, and define well group annotations to offer greater flexibility in the interpretation workflow. Docking windows and panels provide the freedom to arrange the workspace as desired. Saving the interpretation configuration of the workspace enables the user to resume the work from where they left off after closing the previous session.Integration
Observe the multi-disciplinary relationships in your geomodel with tightly integratred and synchronous Map, Cross Section and 3D views. GVERSE Geo+ is designed for the geoscientists who work on integrated data sets that include geological, petrophysical, geophysical, drilling, and GIS data. It includes an integrated map, cross section, and 3D view of the geomodel which enables you to work in 2D or 3D views simultaneously. Use the GeoSurface Model tool to efficiently source and generate surfaces and faults and model complex geometries such as unconformities, channels, and subcrop maps, conformance relationships among surfaces, and fault offset and automatic fault polygon generation on all the views of GVERSE Geo+.Integration with GVERSE Petrophysics
Considering the importance of petrophysics in understand the reservoir, the application facilitates the representation of petrophysical properties (i.e. porosity, saturation and geomechanics etc.) based on GVERSE Petrophysics models. These petrophysical modeling results can be displayed on the fence diagrams as curves to better understand the character of the reservoir or on presentation templates on the cross section view.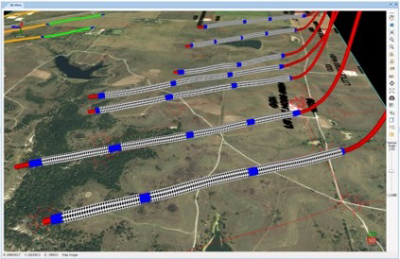
Integration with GVERSE Geophysics
Incorporate your seismic interpretation into your geomodel with dynamically depth converted horizons, faults, and seismic backdrops on cross sections and fence diagrams. Update the velocity model with interpreted interwell points from your smartSTRAT geosteered well for the most up-to-date depth conversion possible.Block Diagrams
GVERSE Geo+ allows us to create block diagrams or gun plot sections that show intersection point of horizontal wellbore with the line of section as it drills through the target formations. In block diagrams, Line of section is laid perpendicular to the wellbore path and in the cross section view they show penetration point of horizontal wellbore drilling inside the target horizon. This helps the drillers in planning inside the drilling section unit as distances between wells can be shown in the block diagram. Absolute and horizontal distances between wells drilling inside the same target can be determined very easily in a block diagram. Likewise, Drilling Section Unit (DSU) boundary distances between corner wells and section boundary can also be determined in block diagram. Additionally, you can add formation thickness, distance filtering on the basis of formations and wellbore custom properties to get the complete picture of drilling wells and their placement inside the respective target formations.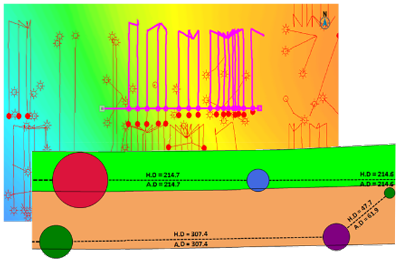
Fence Diagrams
Facilitate a better understanding of the reservoir by creating fence diagrams of the open cross sections. This feature assists in analyzing and representing litho-stratigraphic relationships, pinchouts and truncations of units, unconformities, structural and stratigraphic traps within the reservoir.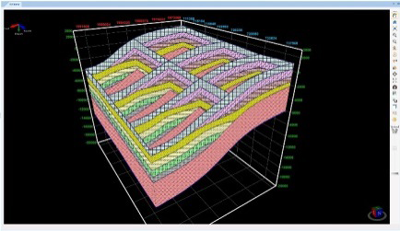
Co-blending
Validate the reservoir behavior by co-blending seismic attributes against interpolated curve properties, lateral lithofacies variation, and related structural geometries on cross sections and fence diagrams.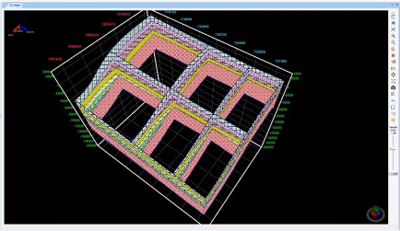
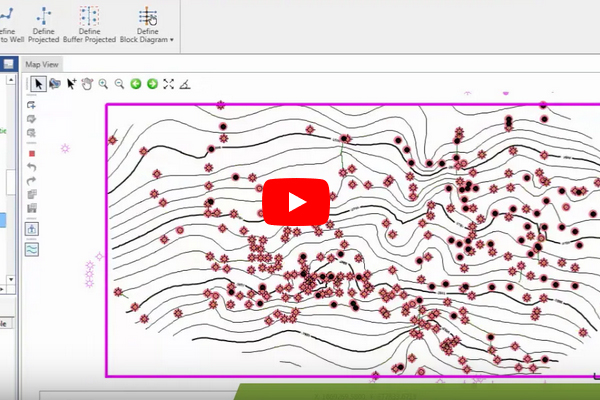
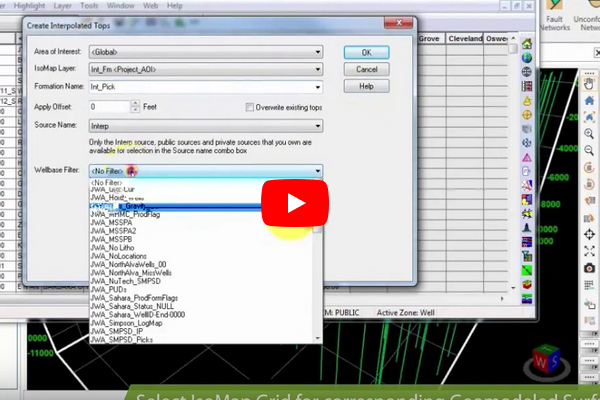
Interpolation
Advance your understanding of the reservoir by analyzing different geological sections and identify lithofacies, stratigraphic sequences, and depositional trends from the logs. GVERSE Geo+ interpolation helps you understand the interplay between lithofacies and depositional or structural trends.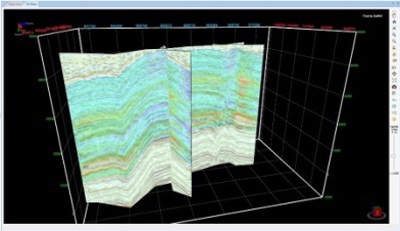
Clipping Planes
In a complex geomodel, clipping can play a significant role in examining the relationships among surfaces and faults. Using GVERSE Geo+ clipping tool, you can easily clip planes vertically or horizontally to keep a specific portion of the scene's geometry in focus and analyze the trajectory of wells as they are drilled through geomodel surfaces. Completion and Perforation Postings
Display Completions stages and Perforation clusters along the wellbore path in 3D View to identify the productive zones of the targeted formations.
Hardware
Minimum
- 2.4 GHz 64-bit processor
- 8GB RAM
- Graphics card Nvidia GeForce 430 or higher with minimum 1GB Dedicated VRAM
- DirectX 11 compatibility of graphics card is required
- 1,366 x 768 screen resolution
Recommended
- Quad 3.2 GHz 64-bit
- 32 GB RAM or greater
- High-end Nvidia GeForce GTX Graphics card X70 - X95 (where X represents GeForce Series 400 onwards) with minimum 2GB dedicated GDDR5 VRAM
- Solid state hard disk
- 1920 x 1080 screen resolution
Software
- Microsoft® .NET 4.5
- Nvidia Driver version 347.62 or higher
- GeoGraphix® 2022.1 is required (for integrated mode only)
Operating Systems
- Windows® 7 Professional x64
- Windows® 7 Enterprise x64
- Windows® 7 Ultimate x64
- Windows® 10 Enterprise x64
- Windows® 10 Professional x64
Licenses
- GVERSE Attributes license version 2022.1
- GeoGraphix license version 2022.1. It is required for integrated mode only.
 |
 |
 |
 |
Surface Offset lines for analyzing drilling targets.- GVERSE Geo+ |
Calculate length, percentage & engineering parameters of wellbore in multiple zones of penetration |
Calculate Well in Zone with GVERSE Geo+ |
Block Diagrams in GVERSE Geo+ |